Suppose you have $5,200 to invest. You could invest all of it today, or you could invest $100 a week for a year. Which approach is better?
Most people answer from instinct. Fundcloud lets you answer from evidence. It is an open-source Python library for portfolio research, and this post explains what it does and how it works in plain English. You do not need a background in finance or programming to follow along.
What is Fundcloud?
Fundcloud is a free library for the Python programming language. A library is a collection of ready-made tools, so you can get straight to your question instead of building the equipment first.
The core idea is simple: test an investment idea on historical prices before you commit real money. You describe a plan, such as "invest $100 every week". Fundcloud replays that plan through years of market history and shows you what would have happened, in both the good periods and the difficult ones.
Professionals call this work portfolio research. It usually means stitching together several separate tools. Fundcloud covers the whole workflow in one place: loading the data, testing the idea, measuring the result, and presenting the findings.
Four terms worth knowing
Investment vocabulary can be a barrier. These four terms are enough for the rest of this post.
- Return is how much your money grew or shrank. If $100 becomes $105, the return is 5%. If it becomes $95, the return is minus 5%.
- Risk is how uneven the journey was. Two investments can finish at the same value, one by a steady climb and the other through sharp swings. Most investors prefer the steady climb, because sharp swings are hard to sit through.
- Drawdown is the largest fall from a previous high. If a portfolio rises to $200 and then slips to $150, that is a 25% drawdown. It tells you how painful the worst stretch would have been.
- Portfolio is everything you hold, taken together. Spreading money across different holdings, so that no single one can do too much damage, is called diversification.
What the library includes
Fundcloud covers a lot of ground, but each part has a clear job.
- Data. Every test starts with price history. Fundcloud can download it from several market data providers or read files you already have.
- Metrics. One short line of code summarises any investment: how much it grew, how uneven the journey was, how deep the worst fall went. A well-known example is the Sharpe ratio, which measures how much return you earned for each unit of risk you took. Higher is better.
- Backtesting. This is the part that replays history. You hand it a plan, and it follows that plan day by day through past prices. It can also account for trading costs, which matter more than most people expect.
- Optimisation. If you want to hold five different assets, how much should go into each? Fundcloud can search for the mix that best balances return against risk.
- Charts and reports. Tables of numbers are hard to read. Fundcloud draws growth charts, drawdown charts and monthly return calendars, and can combine them into a single report as a web page, a PDF or an Excel file.
- Pattern detection. Some traders look for recurring shapes in price charts, such as the "head and shoulders". Fundcloud can find these shapes automatically and then test whether they were actually worth acting on.
- Validation. It is easy to fool yourself by testing an idea on the same data you used to come up with it. Fundcloud includes testing methods designed to prevent that, so a good result is more likely to be a real one.
A first experiment: all at once, or a little at a time?
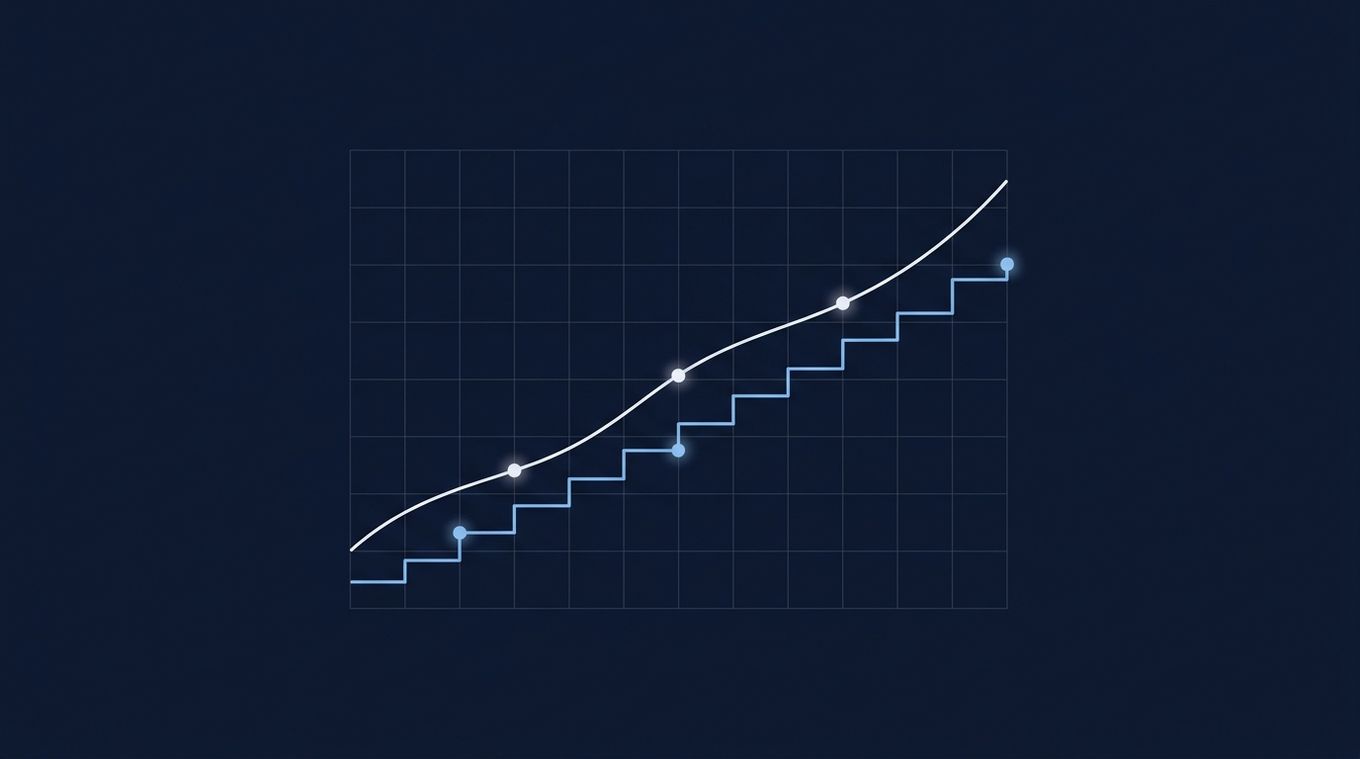
Back to the opening question. Here is how the comparison looks in Fundcloud. Assume prices is a table of historical prices that has already been loaded.
lump_sum = Simulator(prices, cash=5200).run_strategy(Hold(weights={"SPY": 1.0}))
weekly = Simulator(prices, cash=5200).run_strategy(DCA(amount=100, horizon="weekly", weights={"SPY": 1.0}))
That is the entire experiment. In plain English:
- Simulator(prices, cash=5200) sets up a replay of this price history with $5,200 available.
- Hold is the first approach: buy on day one and keep holding. DCA is the second: invest a fixed amount on a regular schedule. DCA stands for dollar-cost averaging, the standard name for investing a little at a time.
- amount=100, horizon="weekly" means $100 every week.
- "SPY" is the ticker of a widely held fund that tracks 500 large American companies.
Which approach wins? It depends on the period. When prices mostly rise, investing everything at once tends to come out ahead, because all the money is working from the first day. When prices are flat or falling, investing gradually often gives a smoother journey, because less depends on a single entry date. The point is that you no longer have to guess. You can run the comparison over any period and read the result yourself.
A second example: three lines to a risk figure
Sometimes you do not need a simulation. You already have a record of results, say five days of gains and losses, and you simply want them measured.
import pandas as pd, fundcloud
returns = pd.Series([0.012, -0.005, 0.008, -0.010, 0.015])
returns.fc.max_drawdown()
The first line loads the tools. The second records five days: up 1.2%, down 0.5%, up 0.8%, down 1%, up 1.5%. The third asks for the worst fall, and Fundcloud answers about minus 1%, which is the fourth day. Replace the last line with returns.fc.sharpe() and you get the return-per-unit-of-risk figure instead. Dozens of measures are available, and they all work the same way.
Why it is fast
Replaying a strategy across ten years of daily prices involves a great deal of arithmetic. Python is easy to read and write, but it is not the fastest language for heavy calculation. Fundcloud therefore runs its most demanding maths in Rust, a language built for speed.
A car is a fair comparison. Python is the steering wheel and pedals, the parts you actually use. Rust is the engine. You get simple controls and a powerful engine, and you never need to look under the bonnet.
What a backtest can and cannot tell you
A backtest is a rehearsal, not a forecast.
Testing on history has one firm limit: the past does not determine the future. A plan that worked for the last ten years can still disappoint next year. Fundcloud helps you understand an idea, compare it with alternatives, and find its weak points before real money is involved. It cannot tell you what will happen next, and nothing in this post is investment advice.
Getting started
Fundcloud is open source under the MIT licence. It is free to use, and anyone can read the code, learn from it, or contribute. If Python is installed on your computer, one command installs the library:
uv add fundcloud
(If you use pip, pip install fundcloud works as well.)
From there:
- Read the quickstart guide, which takes about a minute.
- Browse the examples on GitHub. There are more than thirty short programs, including the comparison from this post.
- Visit the project on GitHub to ask a question or report a problem.
Built on open source
Fundcloud builds on excellent open-source work, including scikit-learn for its machine-learning foundations, skfolio for portfolio optimisation, and TA-Lib for more than 170 technical indicators. Every Fundcloud component is designed to work alongside these projects, so nothing you learn here locks you in.
All at once, or a little at a time? You now have a way to find out.